Host anomaly detection API - GET configuration
- Reference
- Published Aug 28, 2019
Gets the configuration of anomaly detection for hosts.
The request produces an application/json payload.
| GET | SaaS | https://{your-environment-id}.live.dynatrace.com/api/config/v1/anomalyDetection/hosts |
| GET | Environment ActiveGate | https://{your-activegate-domain}:9999/e/{your-environment-id}/api/config/v1/anomalyDetection/hosts |
Authentication
To execute this request, you need an access token with ReadConfig scope.
To learn how to obtain and use it, see Tokens and authentication.
Parameters
The request doesn't provide any configurable parameters.
Response
Response codes
| Code | Type | Description |
|---|---|---|
| 200 | Hosts | Success |
Response body objects
The HostsAnomalyDetectionConfig object
Configuration of anomaly detection for hosts.
| Element | Type | Description |
|---|---|---|
| connectionLostDetection | Connection | Configuration of lost connection detection. |
| diskLowInodesDetection | Disk | Configuration of low disk inodes number detection. |
| diskLowSpaceDetection | Disk | Configuration of low disk space detection. |
| diskSlowWritesAndReadsDetection | Disk | Configuration of slow running disks detection. |
| highCpuSaturationDetection | High | Configuration of high CPU saturation detection |
| highGcActivityDetection | High | Configuration of high Garbage Collector activity detection. |
| highMemoryDetection | High | Configuration of high memory usage detection. |
| highNetworkDetection | High | Configuration of high network utilization detection. |
| metadata | Configuration | Metadata useful for debugging |
| networkDroppedPacketsDetection | Network | Configuration of high number of dropped packets detection. |
| networkErrorsDetection | Network | Configuration of high number of network errors detection. |
| networkHighRetransmissionDetection | Network | Configuration of high retransmission rate detection. |
| networkTcpProblemsDetection | Network | Configuration of TCP connectivity problems detection. |
| outOfMemoryDetection | Out | Configuration of Java out of memory problems detection. |
| outOfThreadsDetection | Out | Configuration of Java out of threads problems detection. |
The ConnectionLostDetectionConfig object
Configuration of lost connection detection.
| Element | Type | Description |
|---|---|---|
| enabled | boolean | The detection is enabled ( |
| enabledOnGracefulShutdowns | boolean | Alert ( |
The DiskLowInodesDetectionConfig object
Configuration of low disk inodes number detection.
| Element | Type | Description |
|---|---|---|
| customThresholds | Disk | Custom thresholds for low disk inodes number. If not set, automatic mode is used. |
| enabled | boolean | The detection is enabled ( |
The DiskLowInodesThresholds object
Custom thresholds for low disk inodes number. If not set, automatic mode is used.
| Element | Type | Description |
|---|---|---|
| freeInodesPercentage | integer | Alert if percentage of available inodes is lower than X% in 3 out of 5 samples. |
The DiskLowSpaceDetectionConfig object
Configuration of low disk space detection.
| Element | Type | Description |
|---|---|---|
| customThresholds | Disk | Custom thresholds for low disk space. If not set, automatic mode is used. |
| enabled | boolean | The detection is enabled ( |
The DiskLowSpaceThresholds object
Custom thresholds for low disk space. If not set, automatic mode is used.
| Element | Type | Description |
|---|---|---|
| freeSpacePercentage | integer | Alert if free disk space is lower than X% in 3 out of 5 samples. |
The DiskSlowWritesAndReadsDetectionConfig object
Configuration of slow running disks detection.
| Element | Type | Description |
|---|---|---|
| customThresholds | Disk | Custom thresholds for slow running disks. If not set, the automatic mode is used. |
| enabled | boolean | The detection is enabled ( |
The DiskSlowWriteAndReadsThresholds object
Custom thresholds for slow running disks. If not set, the automatic mode is used.
| Element | Type | Description |
|---|---|---|
| writeAndReadTime | integer | Alert if disk read/write time is higher than X milliseconds in 3 out of 5 samples. |
The HighCpuSaturationDetectionConfig object
Configuration of high CPU saturation detection
| Element | Type | Description |
|---|---|---|
| customThresholds | High | Custom thresholds for high CPU saturation. If not set then the automatic mode is used. |
| enabled | boolean | The detection is enabled ( |
The HighCpuSaturationThresholds object
Custom thresholds for high CPU saturation. If not set then the automatic mode is used.
| Element | Type | Description |
|---|---|---|
| cpuSaturation | integer | Alert if CPU usage is higher than X% in 3 out of 5 samples. |
The HighGcActivityDetectionConfig object
Configuration of high Garbage Collector activity detection.
| Element | Type | Description |
|---|---|---|
| customThresholds | High | Custom thresholds for high GC activity. If not set, automatic mode is used. Meeting any of these conditions triggers an alert. |
| enabled | boolean | The detection is enabled ( |
The HighGcActivityThresholds object
Custom thresholds for high GC activity. If not set, automatic mode is used.
Meeting any of these conditions triggers an alert.
| Element | Type | Description |
|---|---|---|
| gcSuspensionPercentage | integer | GC suspension is higher than X% in 3 out of 5 samples. |
| gcTimePercentage | integer | GC time is higher than X% in 3 out of 5 samples. |
The HighMemoryDetectionConfig object
Configuration of high memory usage detection.
| Element | Type | Description |
|---|---|---|
| customThresholds | High | Custom thresholds for high memory usage. If not set then the automatic mode is used. Both conditions must be met to trigger an alert. |
| enabled | boolean | The detection is enabled ( |
The HighMemoryThresholds object
Custom thresholds for high memory usage. If not set then the automatic mode is used.
Both conditions must be met to trigger an alert.
| Element | Type | Description |
|---|---|---|
| pageFaultsPerSecondNonWindows | integer | Memory page fault rate is higher than X faults per second on Linux. |
| pageFaultsPerSecondWindows | integer | Memory page fault rate is higher than X faults per second on Windows. |
| usedMemoryPercentageNonWindows | integer | Memory usage is higher than X% on Linux. |
| usedMemoryPercentageWindows | integer | Memory usage is higher than X% on Windows. |
The HighNetworkDetectionConfig object
Configuration of high network utilization detection.
| Element | Type | Description |
|---|---|---|
| customThresholds | High | Custom thresholds for high network utilization. If not set, automatic mode is used. |
| enabled | boolean | The detection is enabled ( |
The HighNetworkThresholds object
Custom thresholds for high network utilization. If not set, automatic mode is used.
| Element | Type | Description |
|---|---|---|
| utilizationPercentage | integer | Alert if sent/received traffic utilization is higher than X% in 3 out of 5 samples. |
The ConfigurationMetadata object
Metadata useful for debugging
| Element | Type | Description |
|---|---|---|
| clusterVersion | string | Dynatrace version. |
| configurationVersions | integer[] | A sorted list of the version numbers of the configuration. |
| currentConfigurationVersions | string[] | A sorted list of version numbers of the configuration. |
The NetworkDroppedPacketsDetectionConfig object
Configuration of high number of dropped packets detection.
| Element | Type | Description |
|---|---|---|
| customThresholds | Network | Custom thresholds for dropped packets. If not set, automatic mode is used. All of these conditions must be met to trigger an alert. |
| enabled | boolean | The detection is enabled ( |
The NetworkDroppedPacketsThresholds object
Custom thresholds for dropped packets. If not set, automatic mode is used.
All of these conditions must be met to trigger an alert.
| Element | Type | Description |
|---|---|---|
| droppedPacketsPercentage | integer | Receive/transmit dropped packet percentage is higher than X% in 3 out of 5 samples. |
| totalPacketsRate | integer | Total receive/transmit packets rate is higher than X packets per second in 3 out of 5 samples. |
The NetworkErrorsDetectionConfig object
Configuration of high number of network errors detection.
| Element | Type | Description |
|---|---|---|
| customThresholds | Network | Custom thresholds for network errors. If not set, automatic mode is used. All of these conditions must be met to trigger an alert. |
| enabled | boolean | The detection is enabled ( |
The NetworkErrorsThresholds object
Custom thresholds for network errors. If not set, automatic mode is used.
All of these conditions must be met to trigger an alert.
| Element | Type | Description |
|---|---|---|
| errorsPercentage | integer | Receive/transmit error packet percentage is higher than X% in 3 out of 5 samples. |
| totalPacketsRate | integer | Total receive/transmit packets rate is higher than X packets per second in 3 out of 5 samples. |
The NetworkHighRetransmissionDetectionConfig object
Configuration of high retransmission rate detection.
| Element | Type | Description |
|---|---|---|
| customThresholds | Network | Custom thresholds for high retransmission rate. If not set, automatic mode is used. All of these conditions must be met to trigger an alert. |
| enabled | boolean | The detection is enabled ( |
The NetworkHighRetransmissionThresholds object
Custom thresholds for high retransmission rate. If not set, automatic mode is used.
All of these conditions must be met to trigger an alert.
| Element | Type | Description |
|---|---|---|
| retransmissionRatePercentage | integer | Retransmission rate is higher than X% in 3 out of 5 samples. |
| retransmittedPacketsNumberPerMinute | integer | Number of retransmitted packets is higher than X packets per minute in 3 out of 5 samples. |
The NetworkTcpProblemsDetectionConfig object
Configuration of TCP connectivity problems detection.
| Element | Type | Description |
|---|---|---|
| customThresholds | Network | Custom thresholds for TCP connection problems. If not set, automatic mode is used. All of these conditions must be met to trigger an alert. |
| enabled | boolean | The detection is enabled ( |
The NetworkTcpProblemsThresholds object
Custom thresholds for TCP connection problems. If not set, automatic mode is used.
All of these conditions must be met to trigger an alert.
| Element | Type | Description |
|---|---|---|
| failedConnectionsNumberPerMinute | integer | Number of failed connections is higher than X connections per minute in 3 out of 5 samples. |
| newConnectionFailuresPercentage | integer | Percentage of new connection failures is higher than X% in 3 out of 5 samples. |
The OutOfMemoryDetectionConfig object
Configuration of Java out of memory problems detection.
| Element | Type | Description |
|---|---|---|
| customThresholds | Out | Custom thresholds for Java out of memory. If not set, automatic mode is used. |
| enabled | boolean | The detection is enabled ( |
The OutOfMemoryThresholds object
Custom thresholds for Java out of memory. If not set, automatic mode is used.
| Element | Type | Description |
|---|---|---|
| outOfMemoryExceptionsNumber | integer | Alert if the number of Java out of memory exceptions is X per minute or higher. |
The OutOfThreadsDetectionConfig object
Configuration of Java out of threads problems detection.
| Element | Type | Description |
|---|---|---|
| customThresholds | Out | Custom thresholds for Java out of threads detection. If not set, automatic mode is used. |
| enabled | boolean | The detection is enabled ( |
The OutOfThreadsThresholds object
Custom thresholds for Java out of threads detection. If not set, automatic mode is used.
| Element | Type | Description |
|---|---|---|
| outOfThreadsExceptionsNumber | integer | Alert if the number of Java out of threads exceptions is X per minute or higher. |
Response body JSON models
{"connectionLostDetection": {"enabled": true,"enabledOnGracefulShutdowns": true},"diskLowInodesDetection": {"customThresholds": {"freeInodesPercentage": 10},"enabled": true},"diskLowSpaceDetection": {"customThresholds": {"freeSpacePercentage": 10},"enabled": true},"diskSlowWritesAndReadsDetection": {"customThresholds": {"writeAndReadTime": 300},"enabled": true},"highCpuSaturationDetection": {"customThresholds": {"cpuSaturation": 90},"enabled": true},"highGcActivityDetection": {"customThresholds": {"gcSuspensionPercentage": 20,"gcTimePercentage": 35},"enabled": true},"highMemoryDetection": {"customThresholds": {"pageFaultsPerSecondNonWindows": 10,"pageFaultsPerSecondWindows": 50,"usedMemoryPercentageNonWindows": 85,"usedMemoryPercentageWindows": 85},"enabled": true},"highNetworkDetection": {"customThresholds": {"utilizationPercentage": 88},"enabled": true},"metadata": {"clusterVersion": "Mock version","configurationVersions": [4,2]},"networkDroppedPacketsDetection": {"customThresholds": {"droppedPacketsPercentage": 8,"totalPacketsRate": 8},"enabled": true},"networkErrorsDetection": {"customThresholds": {"errorsPercentage": 9,"totalPacketsRate": 9},"enabled": true},"networkHighRetransmissionDetection": {"customThresholds": {"retransmissionRatePercentage": 15,"retransmittedPacketsNumberPerMinute": 15},"enabled": true},"networkTcpProblemsDetection": {"customThresholds": {"failedConnectionsNumberPerMinute": 5,"newConnectionFailuresPercentage": 5},"enabled": true},"outOfMemoryDetection": {"customThresholds": {"outOfMemoryExceptionsNumber": 2},"enabled": true},"outOfThreadsDetection": {"customThresholds": {"outOfThreadsExceptionsNumber": 2},"enabled": true}}
Example
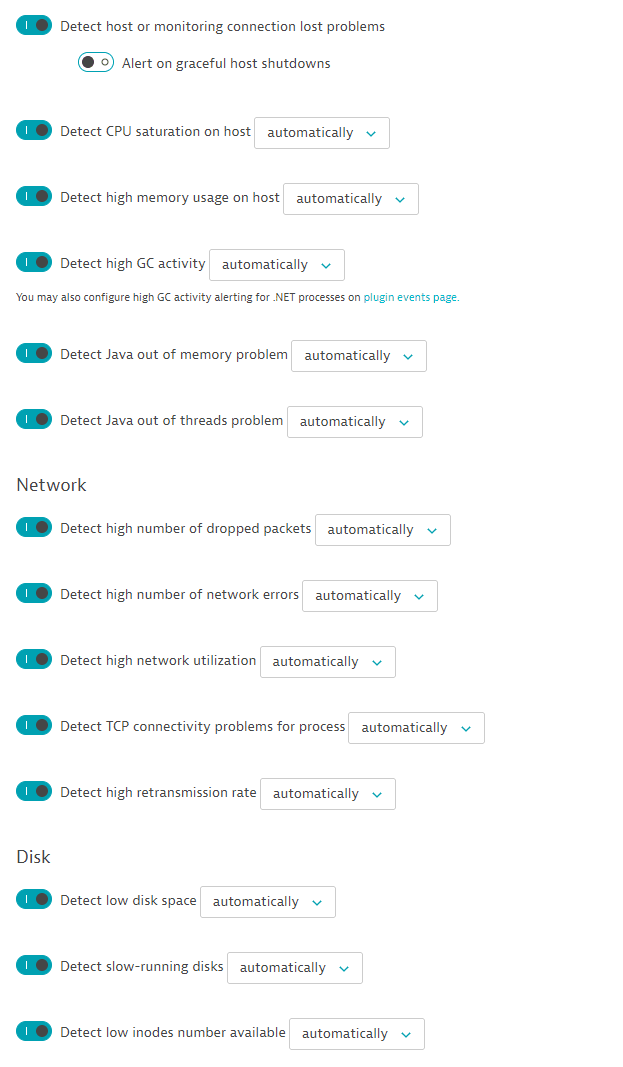
In this example, the request lists the current configuration of anomaly detection for hosts.
The API token is passed in the Authorization header.
The configuration has the following settings:
Curl
curl -X GET \https://mySampleEnv.live.dynatrace.com/api/config/v1/anomalyDetection/hosts \-H 'Authorization: Api-Token dt0c01.abc123.abcdefjhij1234567890'
Request URL
https://mySampleEnv.live.dynatrace.com/api/config/v1/anomalyDetection/hosts
Response body
{"metadata": {"clusterVersion": "1.163.5.20190201-130834","configurationVersions": [91]},"connectionLostDetection": {"enabled": true,"enabledOnGracefulShutdowns": false},"highCpuSaturationDetection": {"enabled": true},"highMemoryDetection": {"enabled": true},"highGcActivityDetection": {"enabled": true},"outOfMemoryDetection": {"enabled": true},"outOfThreadsDetection": {"enabled": true},"networkDroppedPacketsDetection": {"enabled": true},"networkErrorsDetection": {"enabled": true},"highNetworkDetection": {"enabled": true},"networkTcpProblemsDetection": {"enabled": true},"networkHighRetransmissionDetection": {"enabled": true},"diskLowSpaceDetection": {"enabled": true},"diskSlowWritesAndReadsDetection": {"enabled": true},"diskLowInodesDetection": {"enabled": true}}
Response code
200