Dynatrace Intelligence Problems use cases
- Latest Dynatrace
- Tutorial
- 5-min read
Custom problems fields are a type of fields that can be created and modified by the user and aren't automatically propagated from events to problems. These fields can be used for a variety of cases, such as viewing additional events sources and metadata or improving notification filtering and access management.
This article provides examples of how to create custom problems fields to:
- Gain a deeper insight into the problem details
- Gain more control over managing access to problem records
- Improve email notification and segments filtering
Surface incident ownership in the problems table
Event sources can attach important metadata, such as dt.owner or app-id, as event fields. This allows you to define custom event fields directly within the configurations of their respective event sources.
Assume that you have a team-specific custom alert that needs to be configured on top of a DQL query to continuously monitor a metric and report a violation event if abnormal behavior is detected. The team's automation framework needs to automatically define a custom event field, dt.owner, containing the owning team's name.
To do this, you need to define your own dt.owner and app-id event fields within the custom alert configuration.
Steps
- Go to
 Anomaly Detection.
 - Select
 New alert > Create your own custom alert.
 - Give your configuration a meaningful Title.
- Expand Configure your query and provide the DQL query to fetch your data.
We recommend that you use the
interval: 1mparameter to ensure proper data resolution for the analysis. - Expand Customize parameters and define the analyzer and its parameters. For details, see Analyzer type and parameters.
- Expand Create an event template and configure the event triggered by the configuration.
Event name
- Set the Event name to
Abnormally high network traffic.
Event description
- Set the Event description to
Abnormally high network traffic was detected for cluster 23.
Event properties
-
Set the following Event properties:
Event property Value dt.source_entity
{dims.dt.source_entity}event.type
ERROR_EVENTevent.name
Abnormally high network trafficevent.description
Abnormally high network traffic was detected for cluster 23dt.owner
app-team-us-23app-id
app-23
- Select Create.
After you add the fields dt.owner and app-id to your custom alert configuration, each resulting violation event will be tagged with these new fields. The next step is to propagate these fields from the single violation events to problems.
To add a new field mapping
- In Dynatrace, go to
 Settings > Dynatrace Intelligence > Root cause analysis > Problem fields.
 - Select New field.
- Set Event name and Problem field to
dt.owner. - Select Add more.
- Set Event name and Problem field to
app-id. - Select Create.
Once this configuration is saved, all newly created problems will automatically include field values from the single events for these keys.
Problem records in Grail are immutable. This means that you can modify the field mapping configuration at any time, but previously recorded problems that were closed before the modifications will not change. Any changes in field mapping or field naming will only apply after the configuration change.
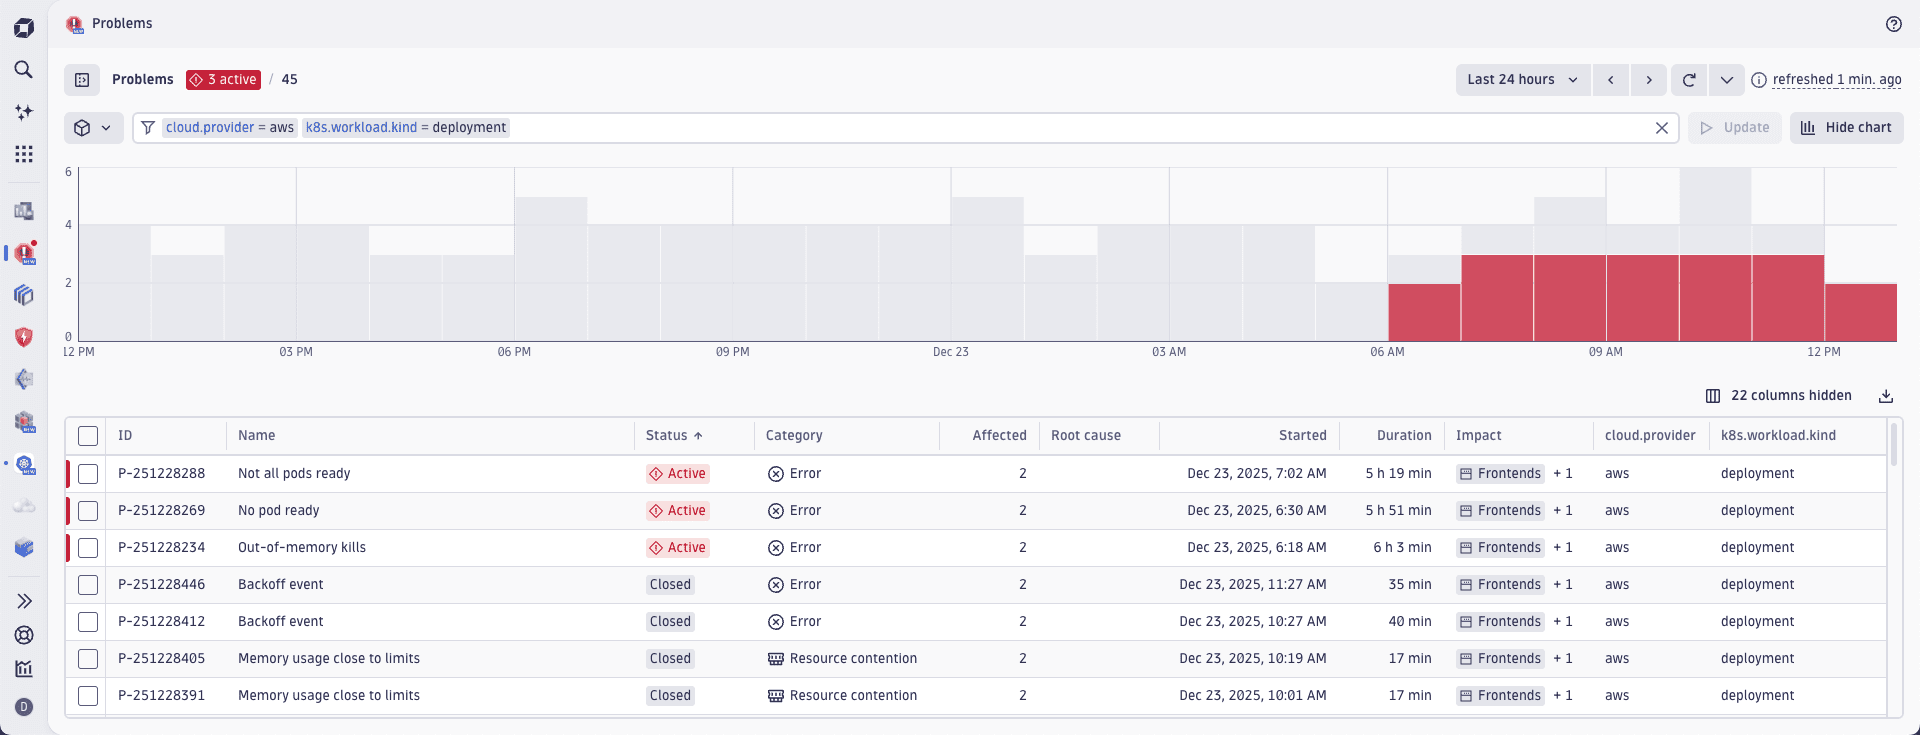
Once this configuration step is complete, you can write DQL queries to filter problems using your newly introduced fields. The problem feed will automatically include your custom fields within the table and the filter bar at the top, as shown below:
Manage the access to problem records
All fields that occur on single violation events and are defined by the Dynatrace permission system as record permissions are automatically mapped onto problems. This allows you to segregate and manage access to the Dynatrace Grail data lake based on reading permissions for various user groups.
Assume you need to apply a policy to problems and Davis events that will allow your team to see the dt.security_context field. You can do so by setting the policy boundaries within your team’s group permissions.
First, you need to configure dt.security_context field within the problem field mapping settings.
Steps
- In Dynatrace, go to Settings > Dynatrace Intelligence > Root cause analysis > Problem fields.
- Select New field.
- Set Event name to
app_id. - Set Problem field to
dt.security_context. - Select Create.
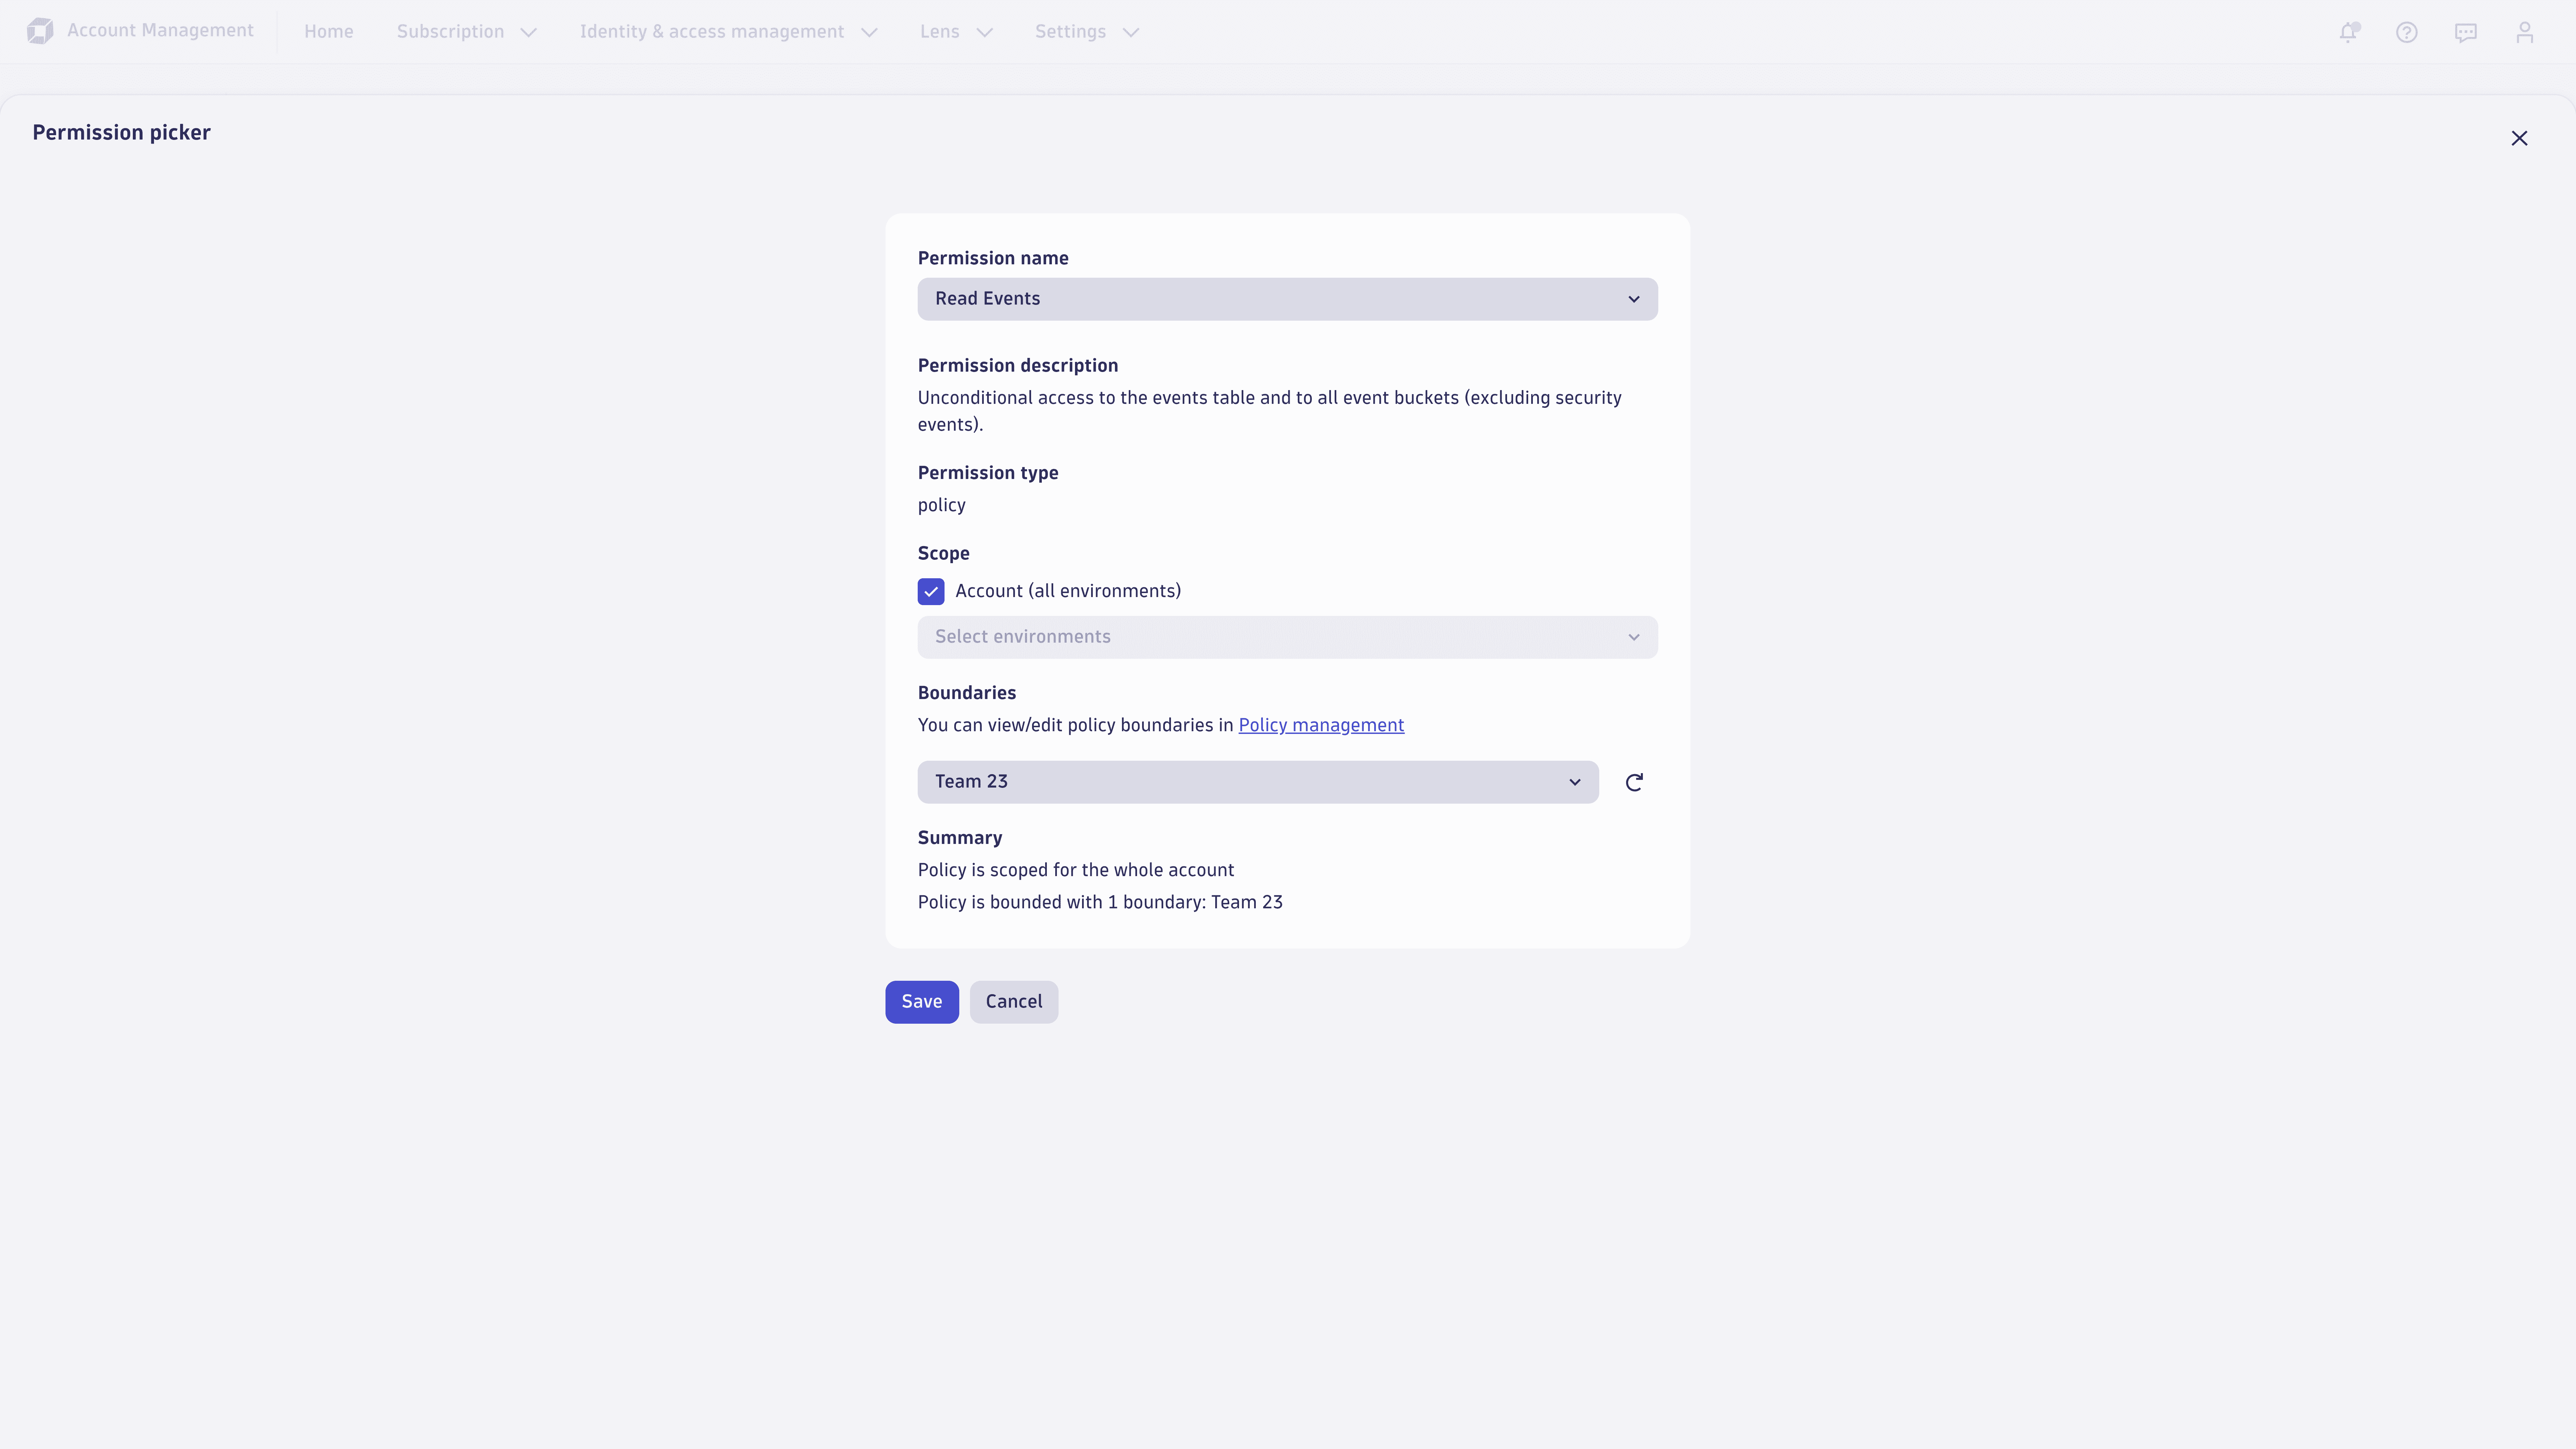
Once the security_context field is successfully mapped on your problems, you can define a new policy boundary that uses the previously mapped security_context field.
Steps
- Go to the Account Management console of your environment.
- Go to Identity & access management > Policy management.
- On the Boundaries tab, select Boundary.
- Set Boundary name to
Team 23 boundary. - Set Boundary query to
storage:dt.security_context IN ("app-23");. - Select Save to create a policy boundary.
Next, create a new Event Read permission and use it to assign the newly created boundary. The result should look similar to the example below:
Finally, map the new permission to an existing group of users.
In addition to applying the policy to problems and Davis events, setting the policy boundary allows you to apply the policy to all available Grail tables consistently. This avoids the unnecessary creation of many policy configs for each Grail table separately and allows a more efficient management of access within large-scale environments.
Filter your personal problem email notifications and segments
Since problem fields are natively stored in Grail, they eliminate the need for costly DQL joins. These fields are also natively transmitted through OpenPipeline and therefore can be used as workflow triggers, ensuring seamless integration.
Setting up filters based on problem fields offers several advantages:
- Scalability: filters can handle large volumes of data efficiently
- Reliability: native storage and transmission ensure consistent and dependable filtering
- Transparency: provides clear insights into the criteria used for filtering problems
You can use problem field filters to:
- Efficiently filter incoming problems within personal email notifications, workflow triggers, and segments.
- Streamline the management of incoming problems, ensuring that relevant issues are promptly identified and addressed.
This approach allows you to enhance the overall efficiency and effectiveness of your monitoring and alerting processes.
 Problems