Single value
- Latest Dynatrace
- 1-min read
- Published Apr 21, 2023
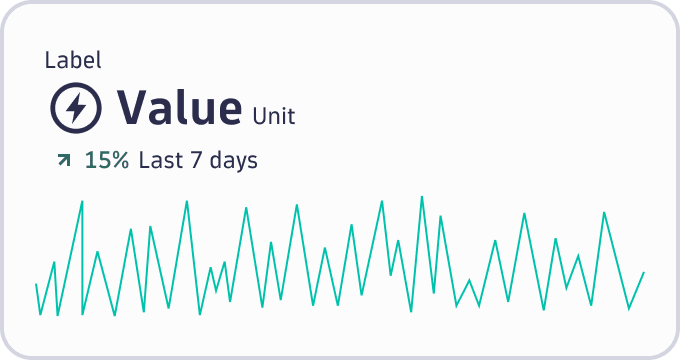
A single value chart displays one large value. This can be textual or numerical. Single values are best for KPI data and visualizing trends. Optionally, the single value can include an icon, label, trend, and sparkline.
