Donut and pie chart
- Latest Dynatrace
- 1-min read
- Published Apr 21, 2023
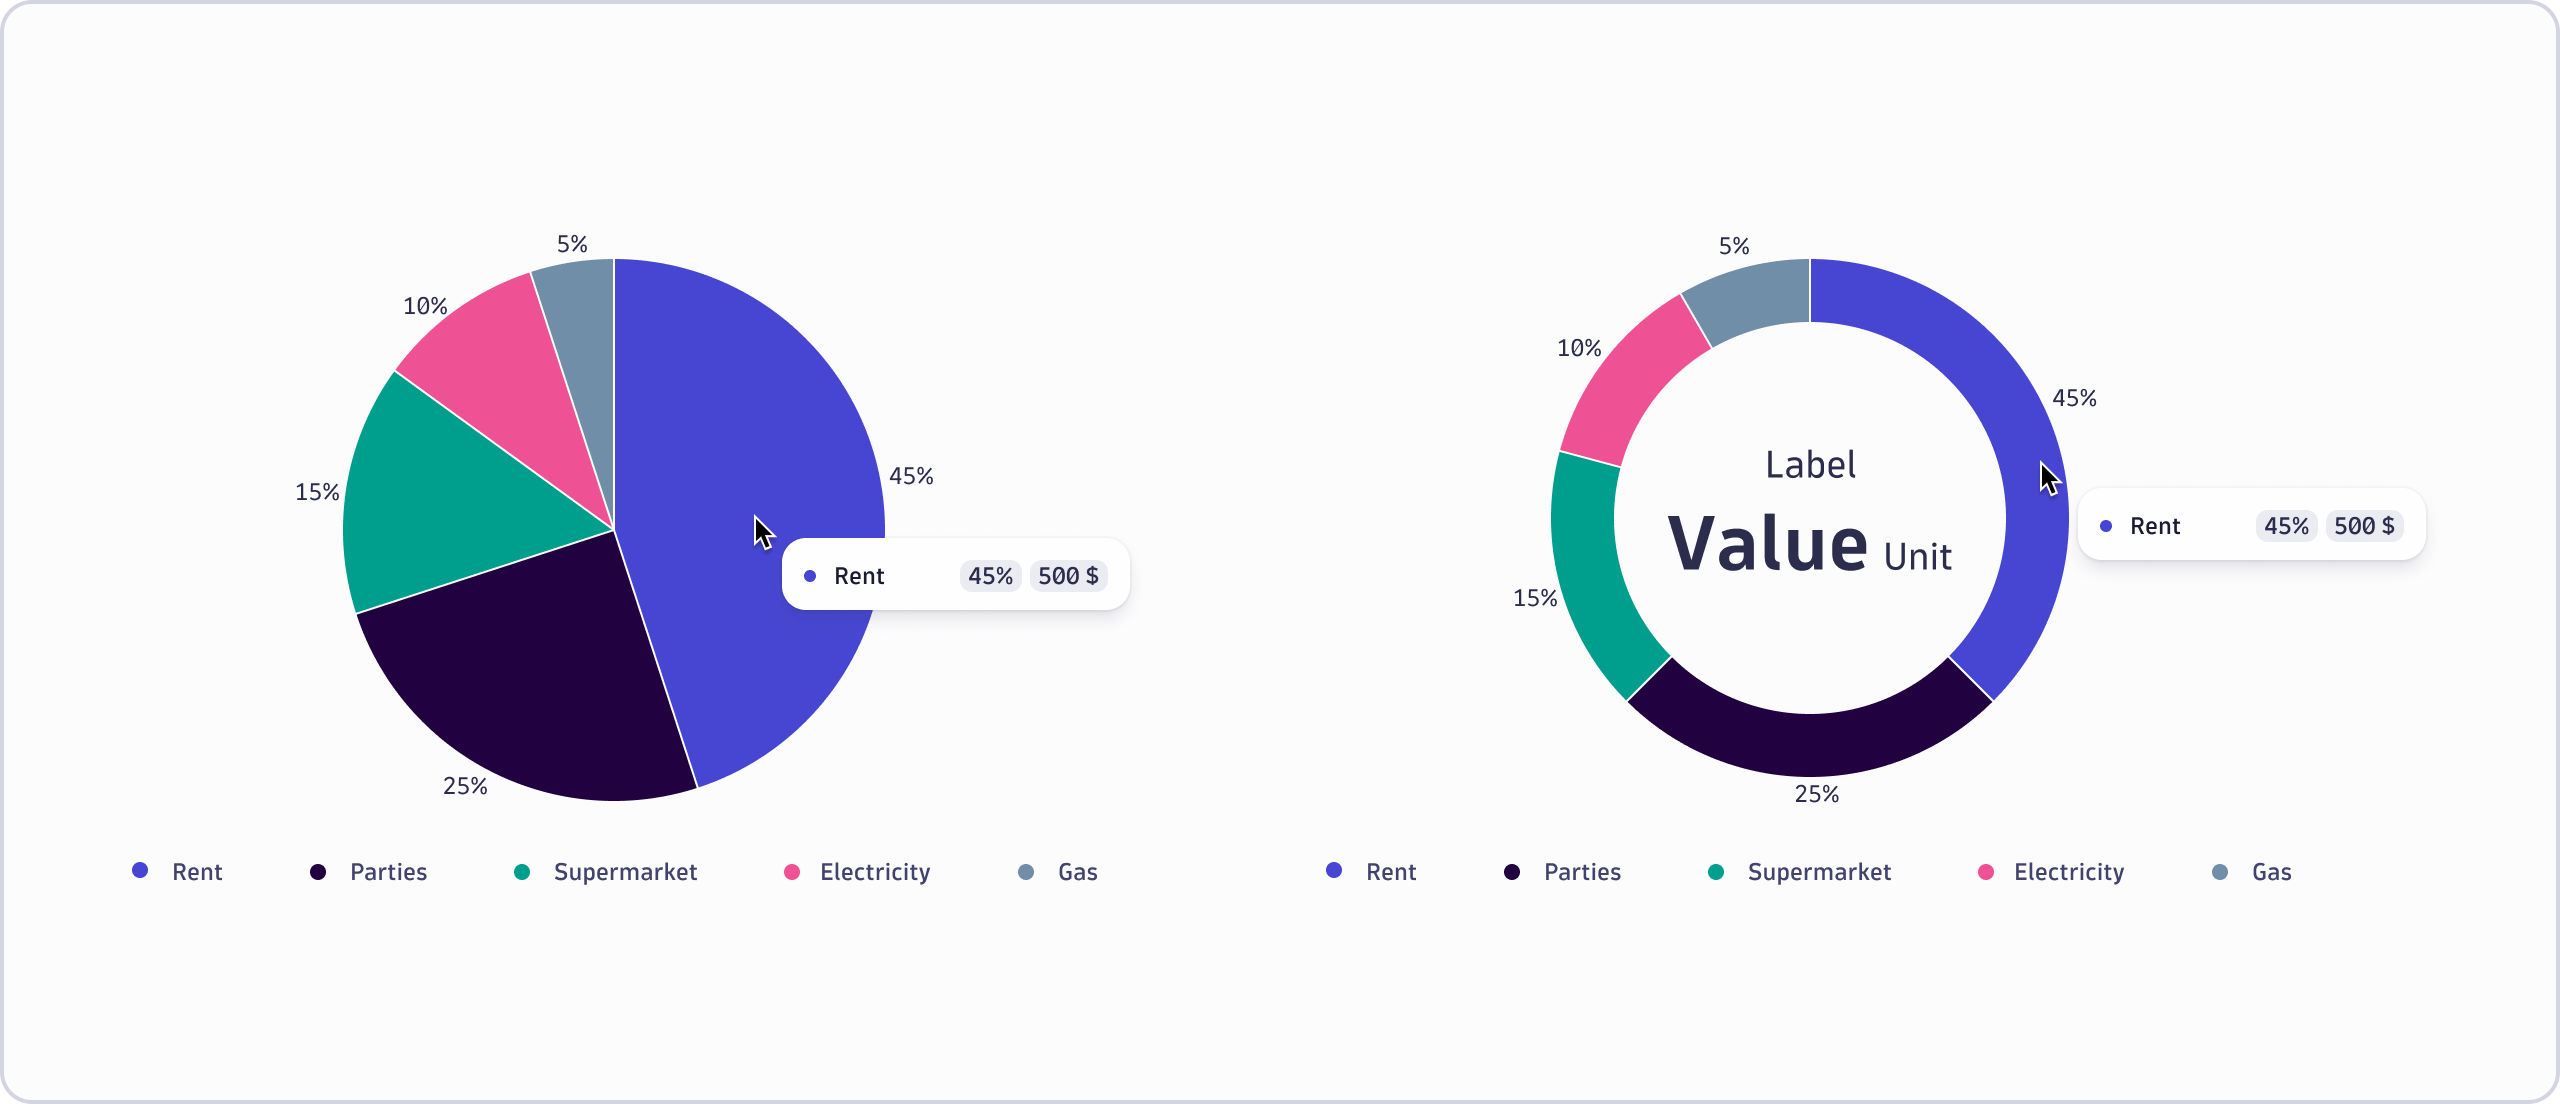
Chart categorical pie donut
The donut and pie charts represent part-to-whole relationships with categorical data.
The extra space in the center of a donut chart can be used to display additional elements such as labels and values.
Segment labels
Segment labels can be used to provide additional contextual information.