Service dependency graph
- Latest Dynatrace
- Explanation
- 5-min read
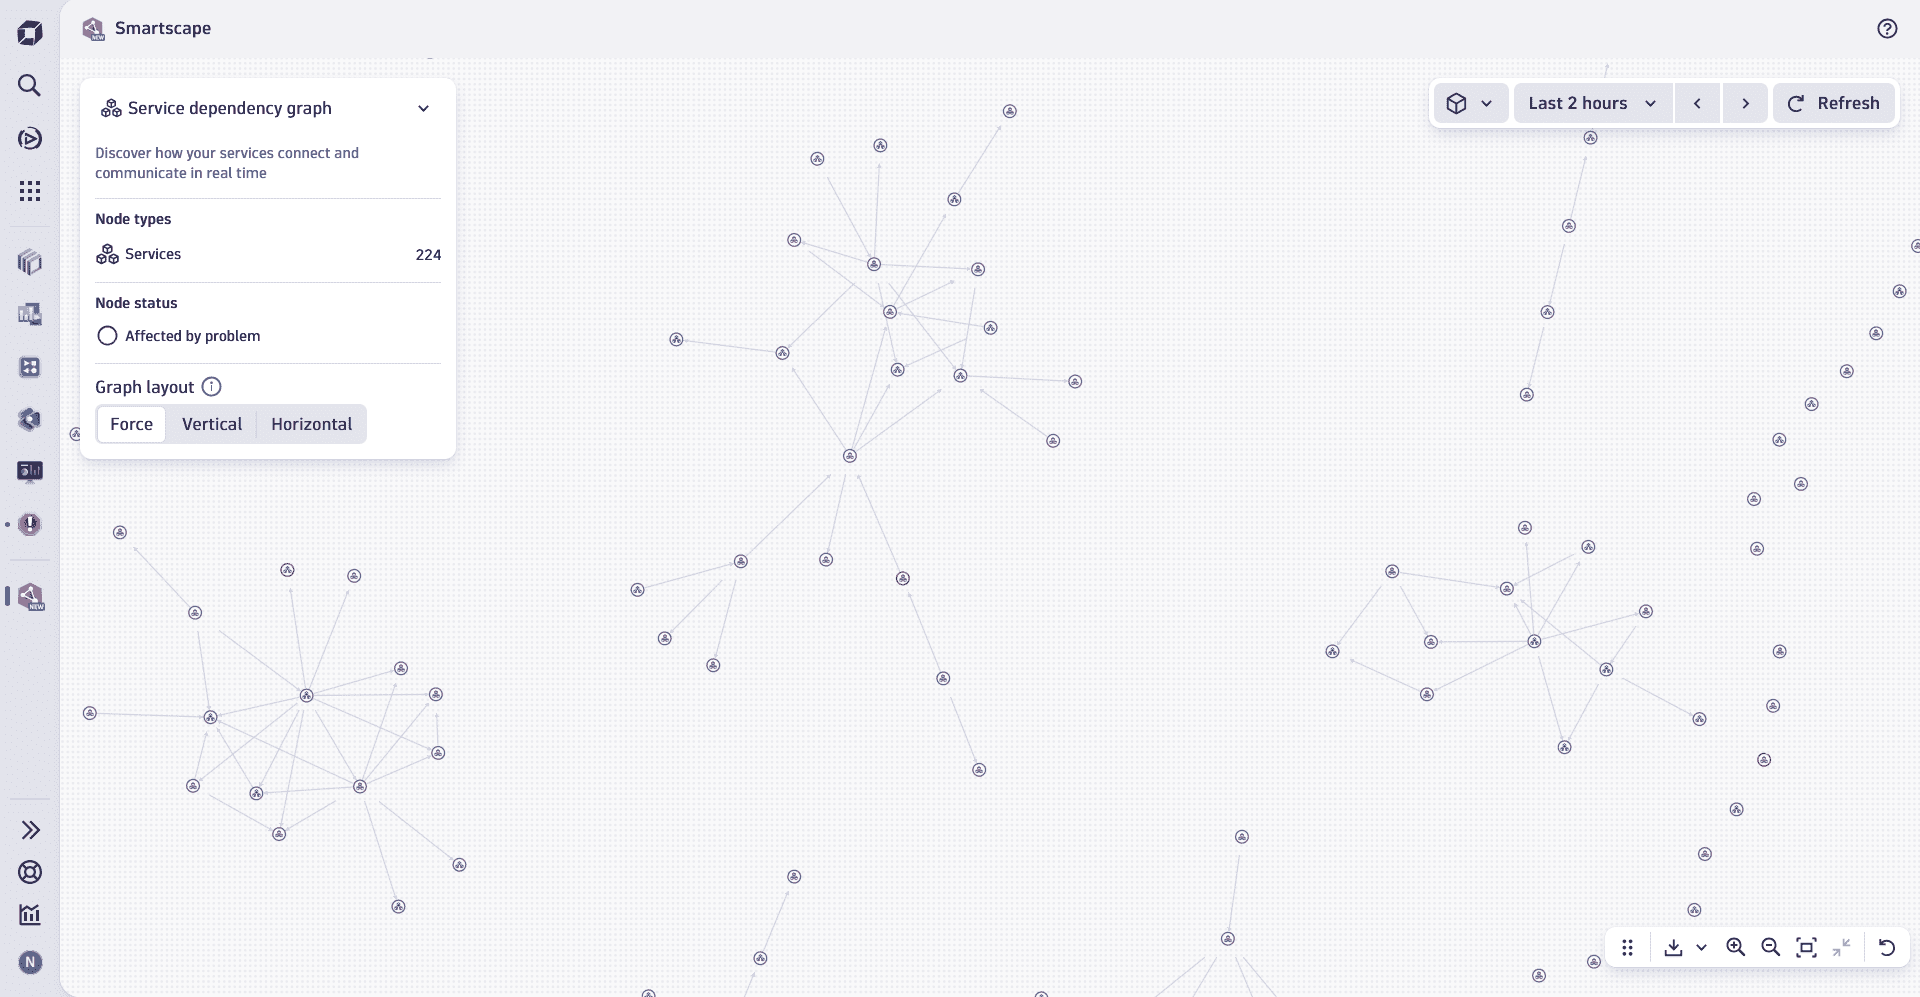
The Service dependency graph view provides a comprehensive visualization of the relationships between all services in your environment. This view focuses on the logical layer of your digital system, allowing you to explore how services interact with one another and uncover critical dependency chains.
By visualizing the interconnections, the Service dependency graph view helps you understand how services influence each other, detect bottlenecks, and assess the potential impact of changes across your entire service landscape.
Constituent entities overview
Nodes
The nodes in the Service dependency graph view represent all services detected within your environment.
Edges
The edges shown between service nodes in this view visualize the calls relationships between services in your environment.
Use cases
You can use Service dependency graph to:
- Identify dependency chains by examining both upstream services that your service depends on, as well as downstream services that rely on your service.
- Analyze the impact of changes by visualizing how updates to one service may ripple across dependent services within the environment.
- Collaborate across teams by sharing a filtered view of the graph, helping other teams understand how their services interact with yours and fostering better communication.
Best practice tips
To use Service dependency graph effectively, we recommend that you:
- Focus on what matters by selecting a segment that defines your area of responsibility, such as specific clusters, namespaces, or workloads relevant to your team.
- Optimize the view's layout and the understanding of dependency chains by making use of the Service dependency graph layout options to either Vertical or Horizontal.
These layout options are only available on filtered-down views with fewer nodes.
- Actively use the pin the tooltip functionality on your service nodes to reveal key metrics such as throughput, error rates, or response times in context.
- Drill down into details of your service in the dedicated
 Services app to access health-relevant signals, metrics, events, and logs.
 - Utilize the View topology in-context view to investigate and understand the underlying infrastructure that a service is running on. For more information, see View topology
Related topics
 Smartscape