Problem graph
- Latest Dynatrace
- Explanation
- 5-min read
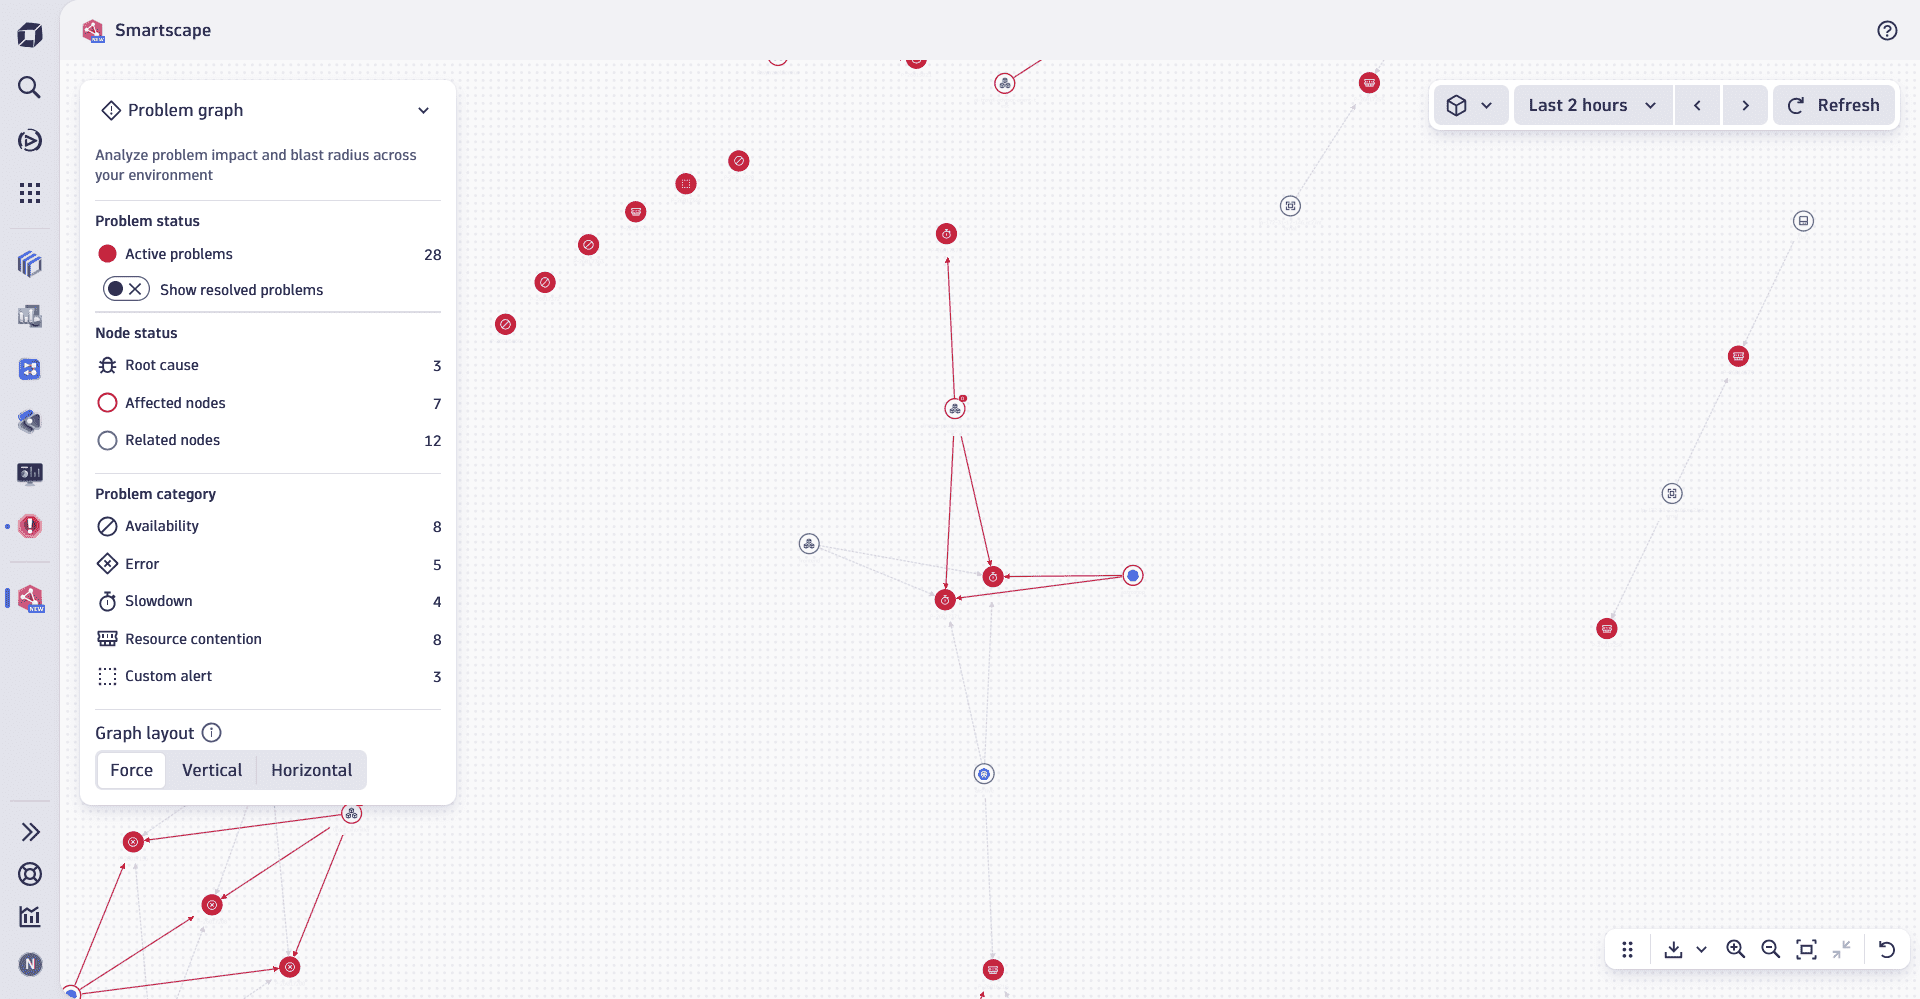
The Problem graph view provides a comprehensive visualization of all detected problems within your environment, including their affected nodes, related nodes, and root causes. By displaying the interrelationships between problems and nodes across your digital system, this view enables you to easily identify highly related or interconnected problems.
For example, you can quickly spot issues that affect a large number of entities or entities impacted by multiple problems.
Constituent entities overview
Nodes
The nodes in the Problem graph view represent all elements involved in a problem, as well as the problem itself. This includes:
- Problems: all detected problems in your environment.
To enhance clarity and focus and avoid clattering, Problem graph only shows
ACTIVEproblems. Problems with the statusCLOSEDwon't appear on the graph. - Affected nodes: any
 Smartscape nodes impacted by a problem, such as hosts, processes, services, applications, or Kubernetes workloads.
 - Related nodes: Any additional Smartscape nodes indirectly connected to a problem, providing broader context for troubleshooting.
Edges
The edges in the Problem graph view connect problems, affected nodes, and related nodes. They illustrate the inter-relationships between all elements involved in the problems across your environment and help you understand the scope and dependencies at a glance.
Edges link affected and related nodes together with problems to provide a visual representation of their relationships.
Edges in the Smartscape Problem graph view are different from Smartscape on Grail edges. For more details about Smartscape edges and how they differ, see Smartscape concepts.
Use cases
You can use Smartscape Problem graph view to quickly identify:
- High-impact problems: quickly determine which problems have the largest impact or "blast radius" by identifying those that affect the largest number of entities.
- Problem-heavy nodes: identify nodes that are affected by multiple problems, helping you prioritize areas that require immediate attention.
Best practice tips
To use Smartscape Problem graph view effectively, we recommend that you:
- Focus on Relevant Areas: narrow down the Smartscape Problem graph view by selecting one or more segments to display only the problems and nodes relevant to you or your team's area of responsibility.
- Analyze further with visual resolution paths: understand the resolution path for problems directly within the graph, without needing to leave the app.
- Drill down and open your problem in the dedicated
 Problems app to access detailed insights, root cause analysis, and resolution recommendations.
 - Investigate specific entities (such as services or hosts) further by opening them in their respective domain applications, such as the
 Infrastructure & Operations,
 ") Kubernetes, or
Kubernetes, or  Services apps.
Related topics
Smartscape